4 Steps to Optimize Your eCommerce Store with Google Analytics (Part 1)
How to Use Enhanced eCommerce to Fix Problems with Your Online Shopping Experience
Of all the businesses in the world, eCommerce businesses may benefit the most from digital analytics tools like Google Analytics. Why?
Think of it this way. Imagine your average brick-and-mortar store (think your local Mom and Pop pizza shop down the street). They know quite a lot about their customers, where they come from, and their restaurant experience.
That’s because all of their customers walk through their doors, ask the waiter or cashier questions about the menu, and order what they want.
If something goes wrong (e.g. the food is not what they expected, or they didn’t know the restaurant is cash-only), they can talk directly to the staff, and the restaurant owners quickly resolve the issue and improve their customers’ experiences.
Well, an eCommerce store is basically the online version of a brick-and-mortar store, but they can’t directly see how customers are interacting with their products or their online store.
There may be millions of customers clicking on different parts of their eCommerce store and dropping off at different stages of the purchase process, but an eCommerce store owner can’t see their screens.
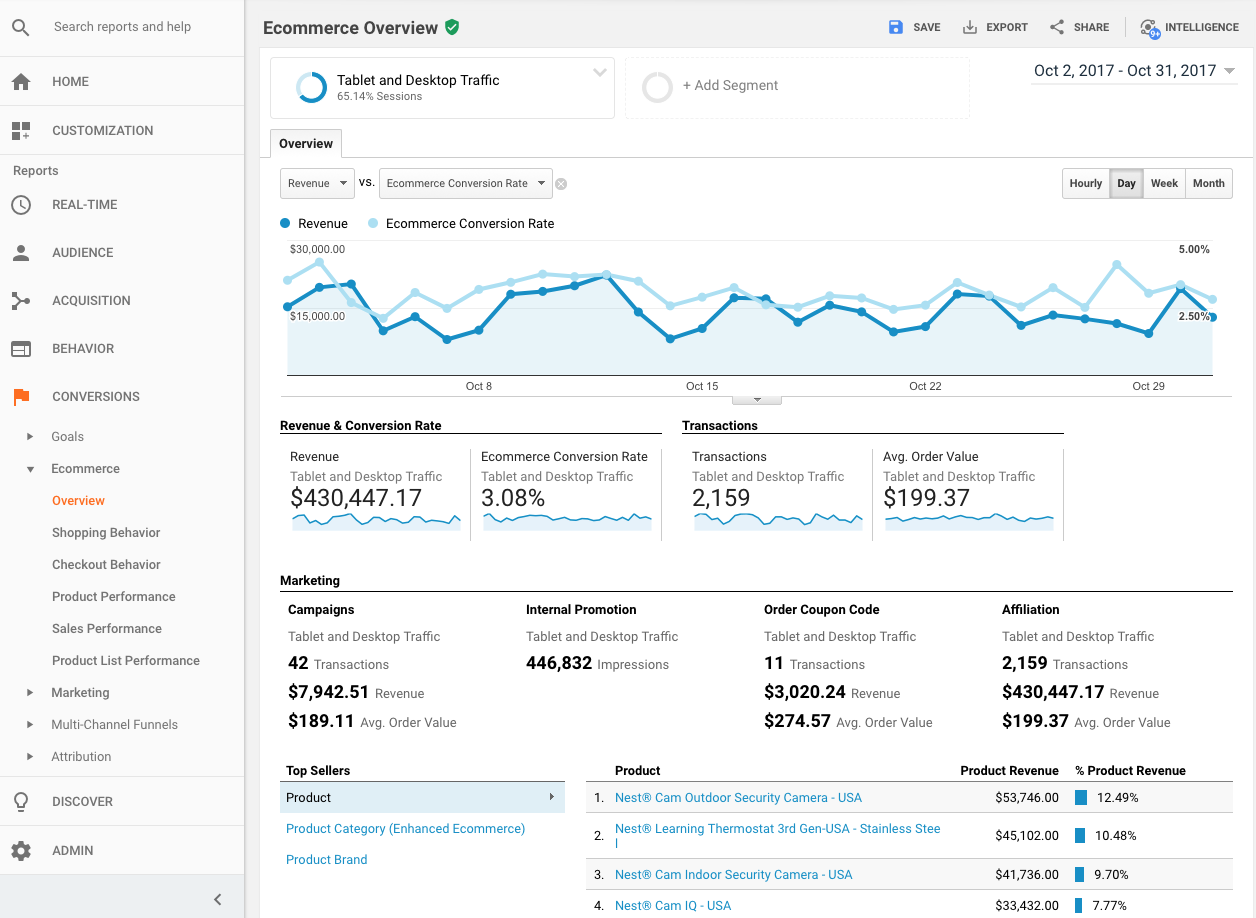
That’s where Google Analytics Ecommerce tracking comes in. It lets you see your eCommerce store the way a brick-and-mortar store owner sees their store — by looking at who their customers are, and how they interact with products.
Otherwise, you’re blind to what’s really going on on your eCommerce website.
There are two main kinds of actionable information you can learn in with your Google Analytics Ecommerce data:
Your buyers’ shopping and checkout behavior
How products and product lists are performing.
You can then optimize your website design by using what you know about how customers are progressing through your site and engaging with products.
As with all digital analytics, you need a framework to guide your analysis, and eCommerce analytics is no exception. Here is our simple 4-step framework:
Step 1: Shopping Behavior Analysis — First, take a look at your customers’ overall shopping behavior from landing page to product page to checkout.
Step 2: Checkout Behavior Analysis — Second, you want to focus specifically on checkout behavior, because checkout is the key stage where users make their purchase, and they can run into friction points on their way to the final transaction.
Step 3: Testing — Third, test your hypotheses for what’s driving the problems with your online shopping process using eCommerce segments.
Step 4: Product Analysis — Lastly, you want to look at how products and product lists are performing, so you can optimize how they are arranged on your site layout (we’ll cover this next week).
But first, before we jump into step 1, let’s briefly talk about how to set up Enhanced eCommerce on Google Analytics.
How to Set Up Enhanced Ecommerce
Enhanced Ecommerce (aka ec.js) is a plugin in Google Analytics that lets you use the Enhanced Ecommerce reports, which track metrics that are specific to eCommerce businesses (e.g. transactions, abandonments, etc).
Whereas other Google Analytics reports collect data after the purchase, Enhanced Ecommerce reports can track the complete customer journey, from landing page to on-site engagement, to purchase, to returns.
Unfortunately, setting up Enhanced Ecommerce involves more than just turning on a switch.
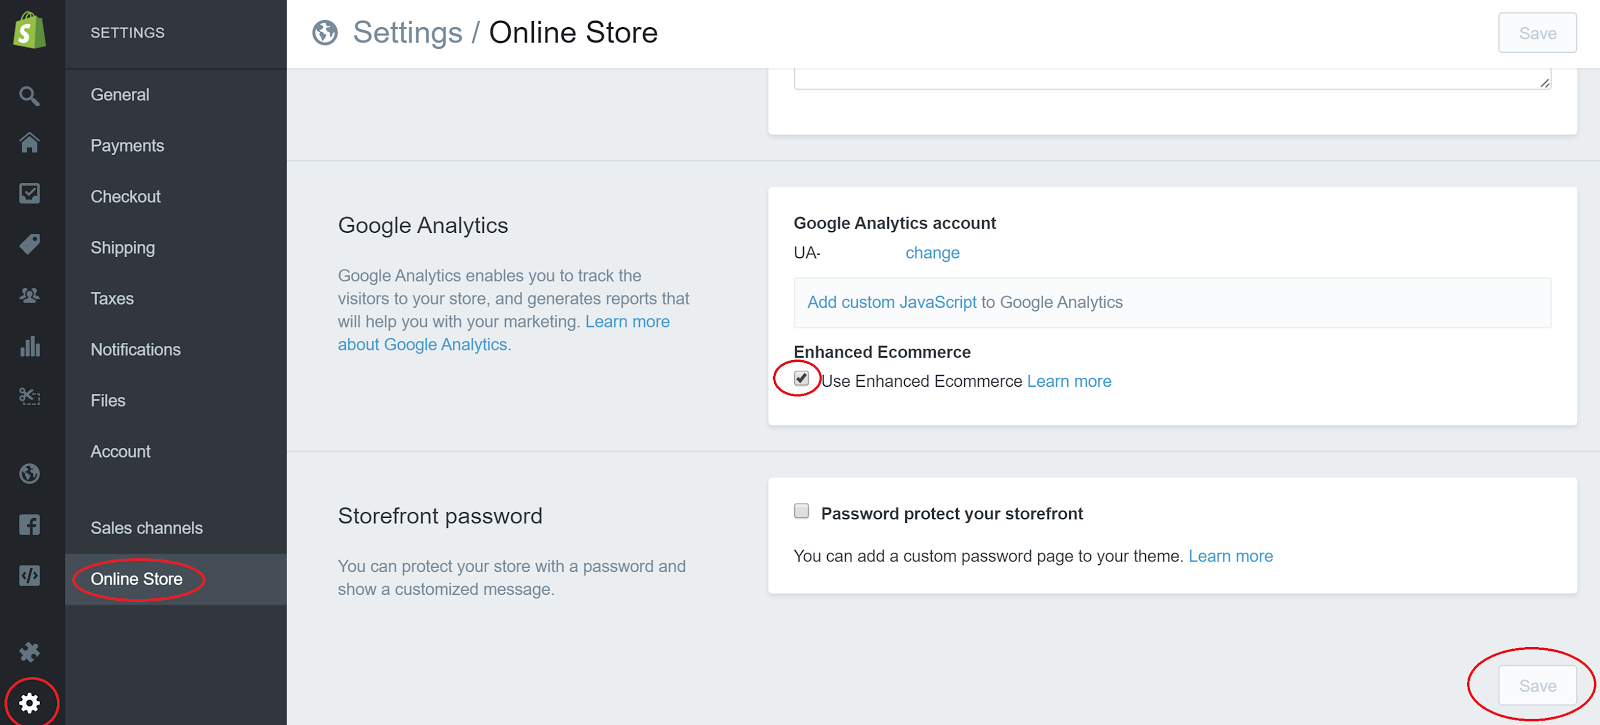
The best-case scenario is if you use an eCommerce platform such as Shopify that has a built-in integration with Google Analytics eCommerce features.
This will make setting up Enhanced Ecommerce much easier. Here are some of the most popular eCommerce platforms:
Shopify has a paid app called Actionable Google Analytics ($39/month)
WooCommerce is an eCommerce platform for WordPress. It also has an Enhanced eCommerce Plugin for Google Analytics.
Magento is an open-source eCommerce solution. It has its own Enhanced eCommerce plugin.
Otherwise, if you don’t use an out-of-the-box eCommerce solution, then you need a web developer who understands javascript. If that’s the case, you will need to follow these 4 steps:
Implement Universal Analytics if you’re not using it already (Admin > Property > Universal Analytics Upgrade)
Use Google Tag Manager to inject the ec.js tracking code on each page of your website.
Go to Admin > View > Ecommerce Settings to enable Enhanced Ecommerce for each view you want to use (this part is just turning on a switch)
Optional: you can also import Product ID metadata and refund data if you’d like
If you’re going with this do-it-yourself method, I would recommend going through this step-by-step tutorial by Kissmetrics: A Step-by-Step Guide to Using Google Analytics' Enhanced Ecommerce Features
Now that you have everything set up, let’s start by analyzing Shopping Behavior!
Shopping Behavior Analysis
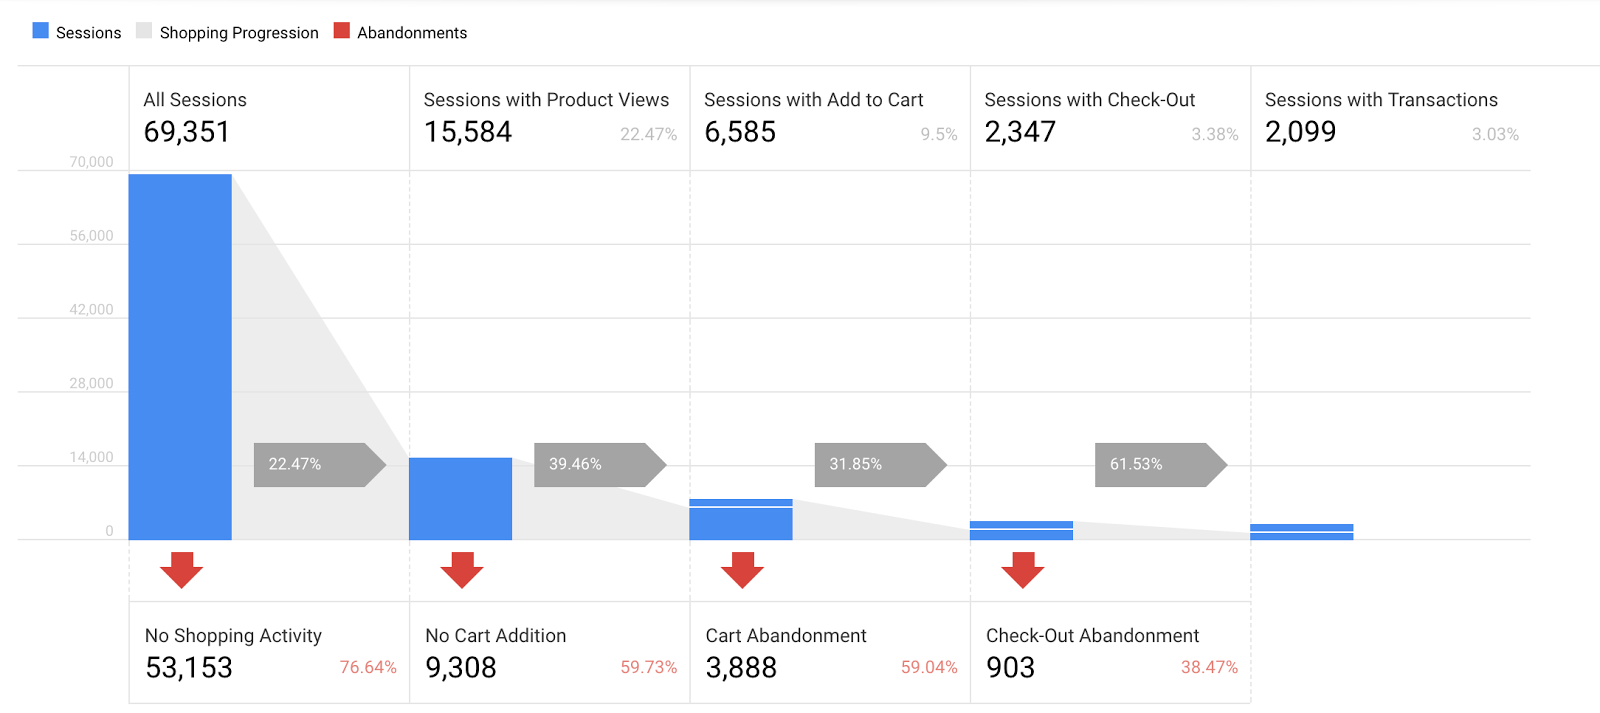
To analyze your customers’ shopping behavior, go to the Shopping Behavior report in Google Analytics. You can find this report at Conversions > Ecommerce > Shopping Behavior.
The Shopping Behavior report shows how customers progress through each step toward purchasing a product on your site. This report helps you identify which pages in the shopping process have high abandonment rates and need improvement.
The graphic in the report helps you visualize what proportion of customers move through the site from one stage of purchasing to the next, and where they abandoned the process.
So how do you know if an abandonment rate is high or low?
We recommend starting by comparing it with your historical data. You can start by comparing your abandonment rates month-to-month, and comparing your rates to those of the same time last year.
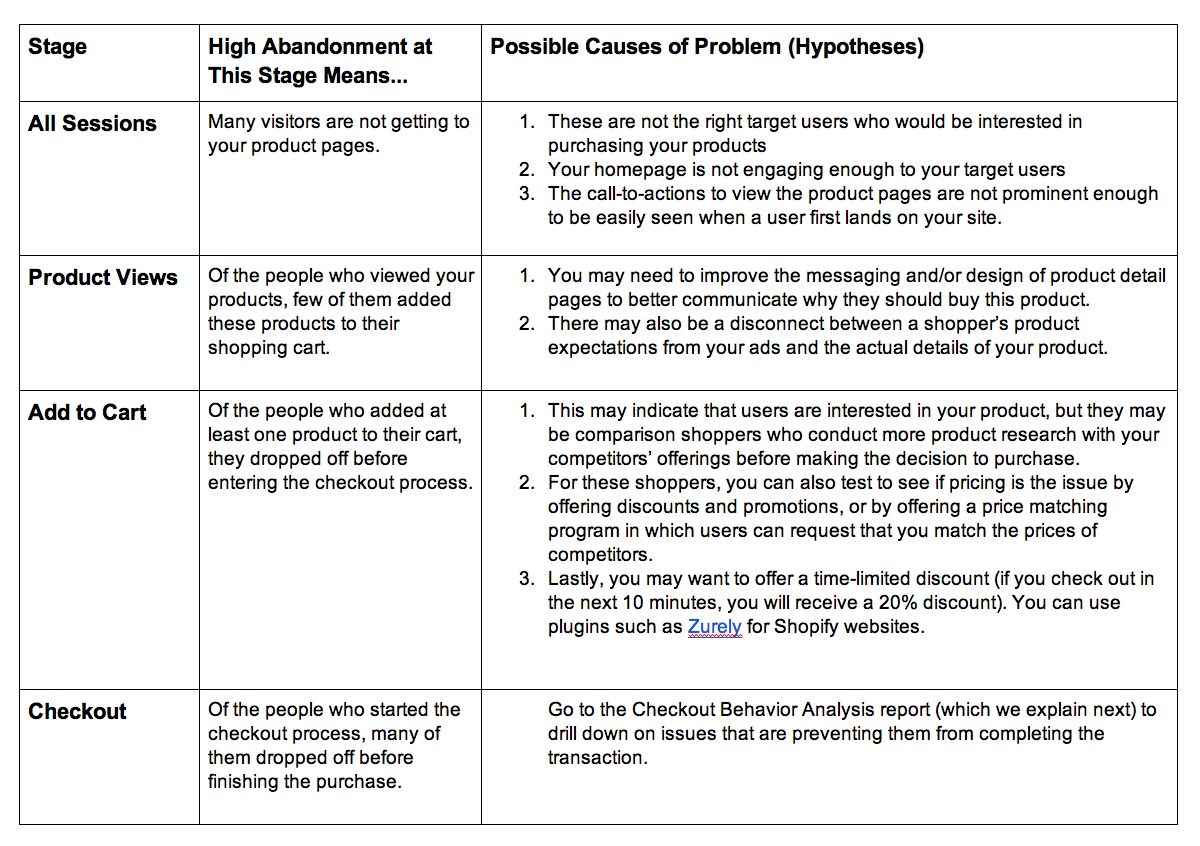
Examining each stage of the shopping process will help you identify existing problems in your customer journey, and give you some hypotheses for what may driving the problems.
Use what you know about the context of your business to develop these hypotheses (e.g. what marketing activities have you started recently that may be driving the change?).
Then test these hypotheses by looking at the relevant segments (more on this later).
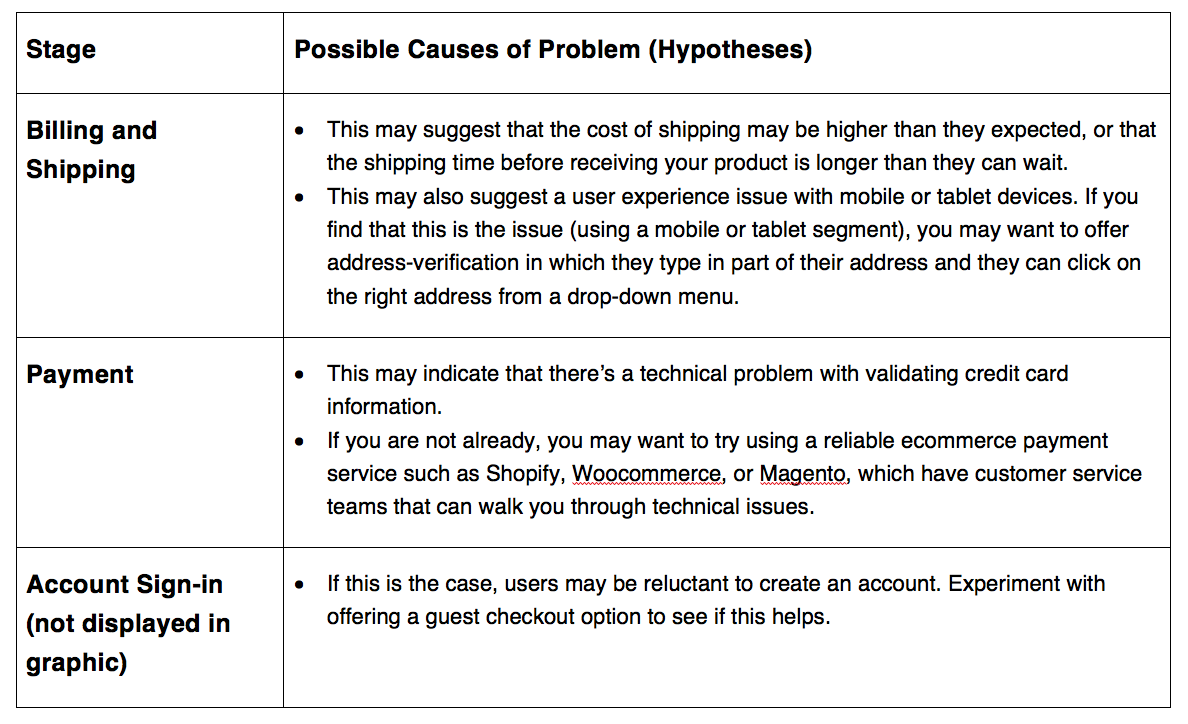
Now let’s take look at each stage of the shopping experience, and consider some examples of what high abandonment at each step might mean.
Get free Marketing Analytics Help From Our Team of Experts
Checkout Behavior Analysis
You can think of Checkout Behavior analysis as an extension of the Shopping Behavior analysis.
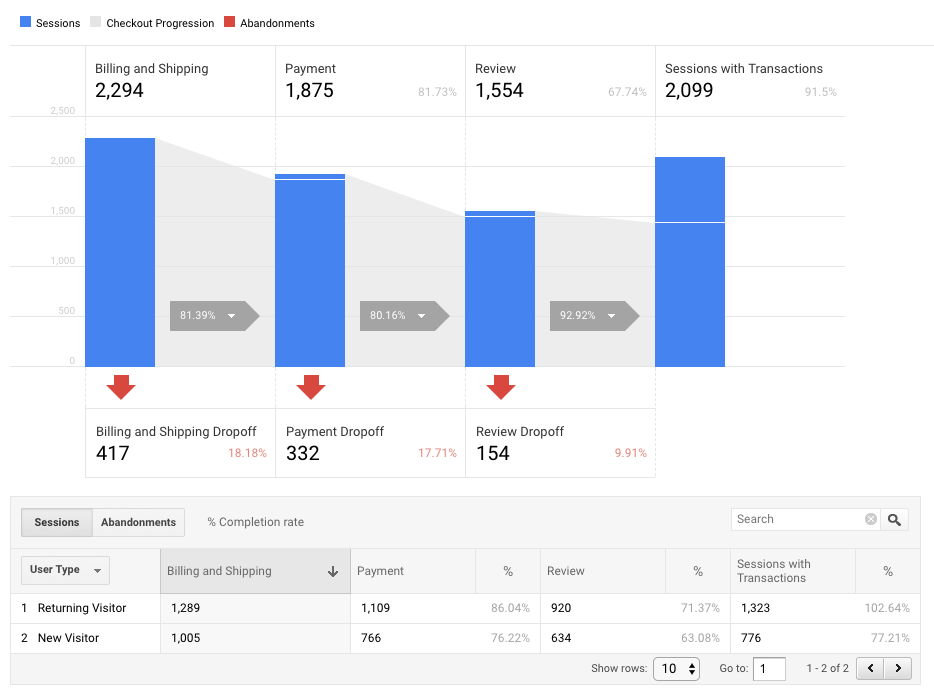
It simply drills down on how users are specifically progressing in the last checkout steps in the Shopping Behavior report. You can find this report at Conversions > Ecommerce > Checkout Behavior.
For example, let’s say there is a sudden increase in your eCommerce store’s cart abandonment rate.
This may be a sign that there is a problem with the shopping cart that’s preventing people from checking out.
This is where the Checkout Behavior report really shines. Like the Shopping Behavior report, it shows the percent of users who abandon your site at each stage of checkout. Let’s take a look at common check-out stages where abandonment is a big issue.
Now that you’ve identified the problems with the shopping and checkout processes, write down hypotheses for what is driving each of these problems.
This is where the science of quantitative digital analytics meets the art of understanding your business qualitatively. Think about the broader context of your business — what business factors might be influencing your eCommerce metrics?
You can start by asking yourself two questions:
How does this change in metrics compare with my historical data? What has changed between this period and that previous period?
How does this change in metrics compare with data for my industry? Is this a company-specific issue or an industry-wide issue?
By using these benchmarks (industry data and historical data), you’ll be able to generate smarter hypotheses about what is driving significant changes in your eCommerce performance.
See how fast-growing eCommerce businesses like William Painter are using data analytics to grow even faster. Download here.
Testing Your Hypothesis
Now that you’ve identified existing issues and hypotheses for their causes, test your hypotheses in one of two ways.
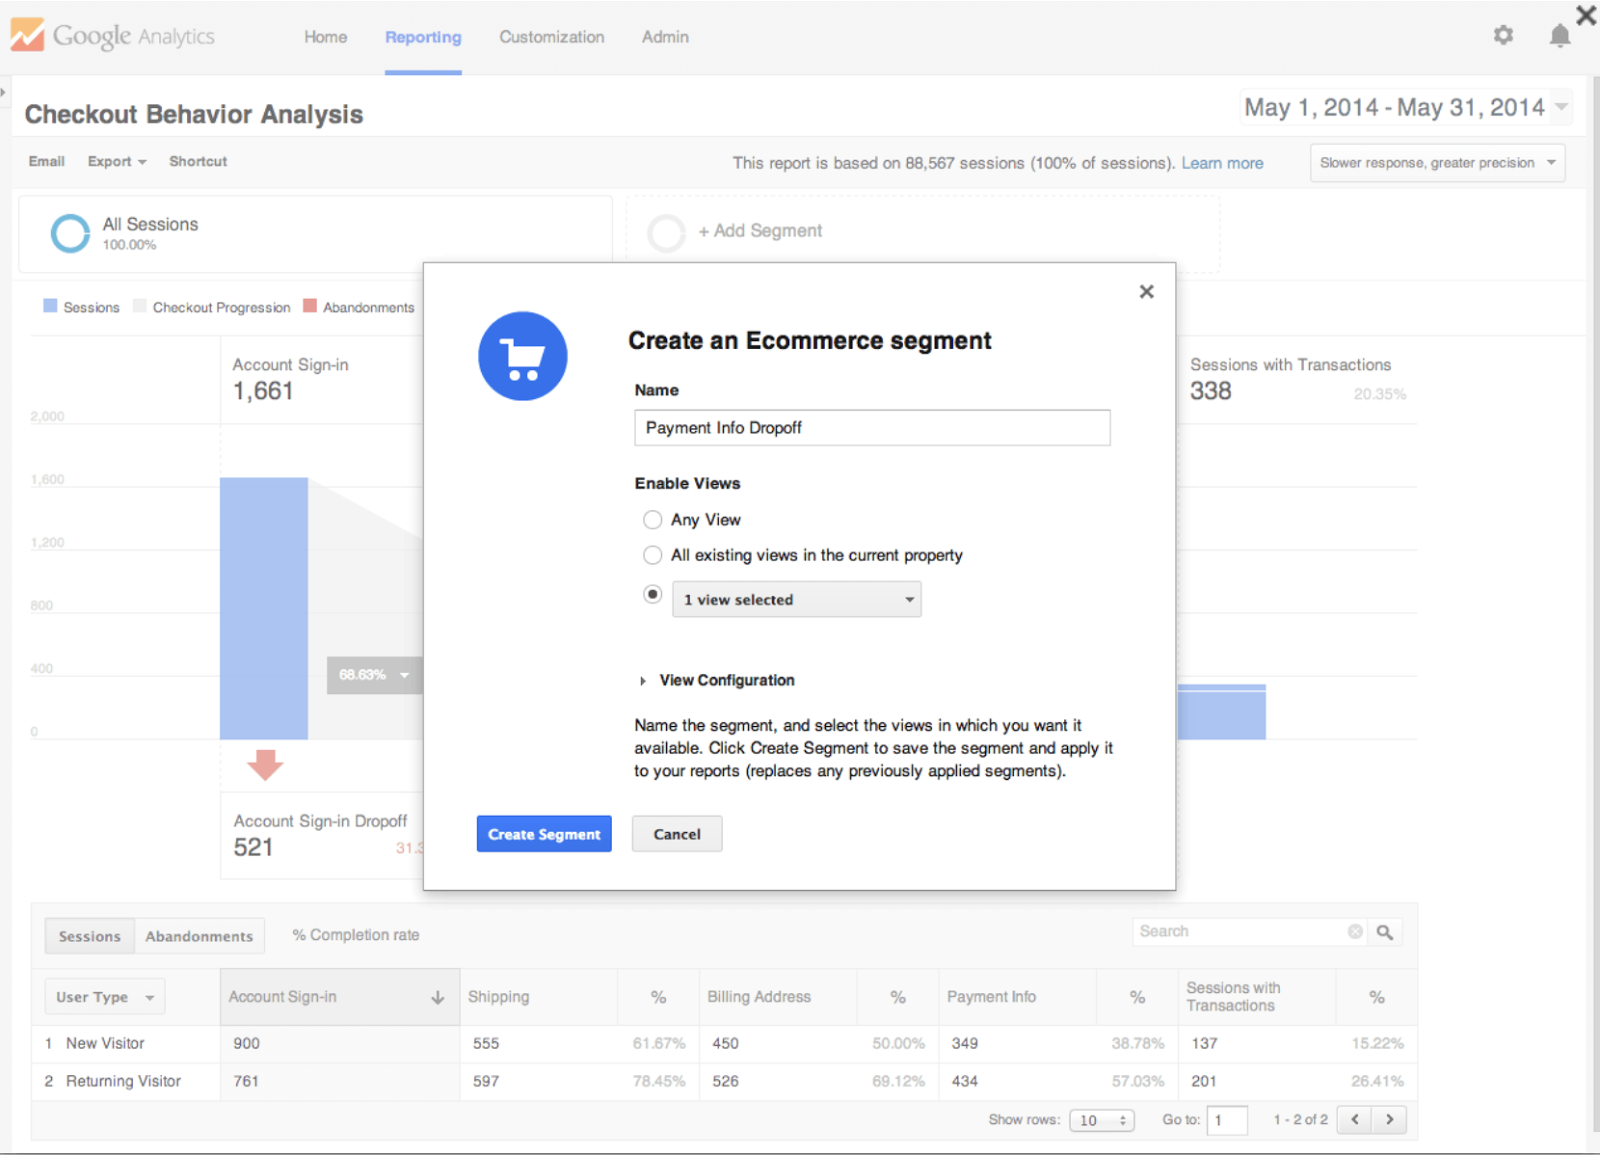
Option 1: Create an eCommerce segment and drill down in other reports.
To create an eCommerce segment, click the red abandonment arrow in the Shopping Behavior or Checkout Behavior report.
Next, see if abandonment is associated with device, browser, language, type of user, or other attributes by applying this segment to these other reports (e.g. the Devices report under Audience > Mobile).
For example, if your hypothesis is that there may be a usability issue with checkout on mobile devices, apply a “Payment Info Dropoff” segment in the Devices report and look at the Transactions column.
Option 2: Compare abandonment rates directly in Shopping Behavior and Checkout Behavior reports.
We can also test our hypotheses directly in this report by clicking the “Abandonments” button to switch from sessions to abandonments.
You can then switch the dimension from “User Type” to other dimensions like “Device Category.”
Compare abandonment rates across devices. In our example of a hypothesis that mobile checkout may be a problem, check to see if mobile abandonment is much higher.
If so, that supports your hypothesis and you should test your mobile checkout process.
This is just one of many examples of how these two reports can help you find opportunities to increase user retention throughout the purchase process.
Next Steps
See how fast-growing eCommerce businesses like William Painter are using data analytics to grow even faster. Download here.
Today, we showed you how your eCommerce business can learn how your customers are navigating through your shopping and checkout process.
Specifically, we learned how to set up Enhanced eCommerce on Google Analytics, how to form smart hypotheses about what’s driving problems in the shopping process, and how to test these hypotheses.
Shopping and checkout behavior analyses are great, but you need to test your hypotheses for what’s holding back your customers completing their purchase.
Shopping and checkout behavior analyses are great, but you need to test your hypotheses for what’s holding back your customers completing their purchase.
Your next step should be to use custom segments in your Shopping and Checkout reports to identify which audiences and traffic sources are driving the most (and least) transaction and revenue for your business.
Focus on segments related to the things you can control, such as audiences you can use for your Adwords campaigns. Check out our previous tutorial to learn more on how to use custom segments in Google Analytics:
As usual, comment below if you have any questions or concerns about this article, love to answer questions or just talk!
If you have any challenges with analytics or just want to know how you can use marketing data for your business growth.
We are offering free analytics consultation to help solve such challenges and offer you personalized insights into how you can grow your business
Book your free consultation today.
See you next time!


